Page 29 - AEC Digital Edition
P. 29

ASEAN MARKET REPORTS

Indonesia

General information

Land Area 1,811,569 sq km.
Climate Tropical; hot, humid, more moderate in highlands.
Capital Jakarta.
Form of Government Republic.
Chief of State and Head of Government President Joko WIDODO.
Population (July 2015 est) 255,993,674.
Population Growth Rate (2015 est) 0.92%.
Ethnic Composition (2010 est) Javanese 40.1%, Sundanese 15.5%, Malay 3.7%, Batak 3.6%, Madurese 3%, Betawi 2.9%,
Minangkabau 2.7%, Buginese 2.7%, Bantenese 2%, Banjarese 1.7%, Balinese 1.7%, Acehnese 1.4%, Dayak 1.4%, Sasak 1.3%,
Chinese 1.2%, other 15%.
Religious Affiliation (2010 est) Muslim 87.2%, Christian 7%, Roman Catholic 2.9%, Hindu 1.7%, other 0.9% (includes
Buddhist and Confucian), unspecified 0.4%.
Birth Rate (2015 est) per 1,000 population 16.72 births.
Death Rate (2015 est) per 1,000 population 6.37 deaths.
Infant Mortality Rate (2015 est) per 1,000 live births 24.29 deaths.
Life Expectancy at Birth (2015 est) Male 69.85 years; Female 75.17 years.

Economy

Monetary Unit 1 Indonesian Rupiah (Rp) = 100 sen.
Exchange Rate (10 Sep 2015) US$1 = Rp14,337.44 (Indonesian Rupiah).
GDP purchasing power parity (2014 est) US$2.676 trillion.
GDP per capita (2014 est) US$10,600.

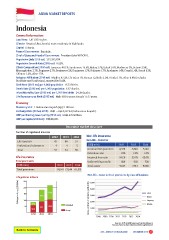
                                            Insurance market structure

Number of registered insurers

                               2012         2013        2014  Non-life insurance
                                              48          51
Life insurers                           47     4           5  Non-life – Statistics
                                              52         56
Professional reinsurers                 4                      (US$ mln)                                                        2012    2013                               2014
                                                               Gross written premium                                            4,330   3,848                              5,148
Total                                   51                     Retention ratio                                                    1.0%    1.0%                              1.0%
                                                               Incurred loss ratio                                              44.1%   39.1%                              42.6%
Life insurance                          2012 2013 2014         Underwriting results
                                        14,141 13,144 10,159   Total assets                                                        820     602                               728
Total premiums                                                                                                                   9,017   7,911                             9,080

 (US$ mln)

 Total premiums

Life policies in force                                                                                                        Non-life – Gross written premiums by class of business

            250                                                                                                                   5,000
Policies in force (US$ bln)
                                                                                              Gross written premiums (US$ mln)
       200                                  Individual                                                                          4,000                                      Total
                                            Group                                                                               3,000                                      Motor
       150 114.4                                                                                                                2,000                                      Property
                                  94.6                                                                                          1,000                                      Marine

       100                                                                                                                             2008 2009 2010 2011 2012 2013 2014
                    26.2

        50 89.1 104.6
                    58.0

                 2012 2013 2014

Back to Contents                                                                                                                                       Sources: 2015 ASEAN Insurance Statistical Report;
                                                                                                                                                   Asosiasi Asuransi Jiwa Indonesia (AAJI); sigma Report

                                                                                                                                AEC – IMPACT ON INSURANCE • DECEMBER 2015 27
   24   25   26   27   28   29   30   31   32   33   34