Page 34 - AEC Digital Edition
P. 34

ASEAN MARKET REPORTS

Singapore

General Information

Land Area 687 sq km.
Climate Tropical; hot, humid, rainy; two distinct monsoon seasons - Northeastern monsoon (December to March) and
Southwestern monsoon (June to September); inter-monsoon - frequent afternoon and early evening thunderstorms.
Form of Government Parliamentary republic.
Chief of State President Tony TAN Keng Yam.
Head of Government Prime Minister LEE Hsien Loong.
Population (July 2015 est) 5,674,472.
Population Growth Rate (2015 est) 1.89%.
Ethnic Composition (2013 est) Chinese 74.2%, Malay 13.3%, Indian 9.2%, other 3.3%.
Religious Affiliation (2010 est) Buddhist 33.9%, Muslim 14.3%, Taoist 11.3%, Catholic 7.1%, Hindu 5.2%, other Christian
11%, other 0.7%, none 16.4%.
Birth Rate (2015 est) per 1,000 population 8.27 births.
Death Rate (2015 est) per 1,000 population 3.43 deaths.
Infant mortality rate (2015 est) per 1,000 live births 2.48 deaths.
Life Expectancy at Birth (2015 est) Male 82.06 years; Female 87.5 years.

Economy

Monetary Unit SGD1 (Singapore dollar) = 100 cents.
Exchange Rate (10 Sep 2015) US$1 = SGD1.42124 (Singapore dollars).
GDP purchasing power parity (2014 est) US$445.2 billion.
GDP per capita (2014 est) US$82,800.

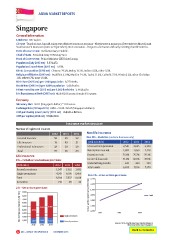
                                            Insurance market structure

Number of registered insurers

                               2012         2013    2014     Non-life insurance
                                 50           38      38
General insurers                  19          19      21     Non-life – Statistics (onshore business only)
Life insurers                    28           29      29
Professional reinsurers          97           86      88     (US$ mln & %)                                                                        2012 2013    2014
Total                                                                                                                                                          2,704
                                                             Gross written premium                                                                2,547 2,625  2,118
                                                                                                                                                               76.3%
                                                             Net claims incurred                                                                  1,892 1,859  47.0%

Life insurance                                               Retention ratio                                                                      76.8% 76.7%    309
                                                                                                                                                               7,370
Life – Individual new business premiums                      Incurred loss ratio                                                                  51.0% 42.0%

(US$ mln)                           2012    2013    2014     Underwriting results                                                                 243 260
Annual premiums                      1,547   1,922   1,652
Single premiums                      4,747   5,605  6,456    Total assets                                                                         6,635 7,016
Total                               6,294    7,527   8,108
Annuities                                                                                                                   Non-life – Gross written premiums
                                       139      20      22
Net written premiums (US$ mln)                                                                                                  2,750
                                                                                            Gross written premiums (US$ mln)
                                                                                                                              2,700

Life – Net written premiums                                                                                                   2, 650

9,000

8,000                                                                                                                         2,600                                              Total
7,000                                                                                                                                                          2014
6,000                                                                                                                         2,550
5,000
                 5,604 6,455                                                                                                  2,500
4,000                                                                                                                         2,450
3,000  4,746

                                                                                                                                      2012  2013

2,000  1,547     1,921       1,652          Single premiums
1,000                                       Annual premiums

       2012      2013        2014                                                                                                           Sources: 2015 ASEAN Insurance Statistical Report;
                                                                                                                                                                Monetary Authority of Singapore

32 AEC – IMPACT ON INSURANCE • DECEMBER 2015                                                                                                                   Back to Contents
   29   30   31   32   33   34   35   36   37   38   39