Page 33 - AEC Digital Edition
P. 33

ASEAN MARKET REPORTS

Philippines

General Information

Land Area 298,170 sq km.
Climate Tropical marine; northeast monsoon (November to April); southwest monsoon (May to October).
Capital Manila.
Form of Government Republic.
Chief of State and Head of Government President Benigno AQUINO.
Population (July 2015 est) 100,998,376.
Population Growth Rate (2015 est) 1.61%.
Ethnic Composition (2000 census) Tagalog 28.1%, Cebuano 13.1%, Ilocano 9%, Bisaya/Binisaya 7.6%, Hiligaynon Ilonggo
7.5%, Bikol 6%, Waray 3.4%, other 25.3%.
Religious Affiliation (2000 census) Catholic 82.9% (Roman Catholic 80.9%, Aglipayan 2%), Muslim 5%, Evangelical 2.8%,
Iglesia ni Kristo 2.3%, other Christian 4.5%, other 1.8%, unspecified 0.6%, none 0.1%.
Birth Rate (2015 est) per 1,000 population 24.27 births.
Death Rate (2015 est) per 1,000 population 6.11 deaths.
Infant Mortality Rate (2015 est) per 1,000 live births 22.34 deaths.
Life Expectancy at Birth (2015 est) Male 65.47 years; Female 72.62 years.

Economy

Monetary Unit P1 (Philippine peso) = 100 centavos.
Exchange Rate (10 Sep 2015) US$1 = P46.9343 (Philippine pesos).
GDP purchasing power parity (2014 est) US$692.2 billion.
GDP per capita (2014 est) US$7,000.

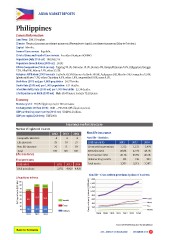
                                               Insurance market structure

Number of registered insurers                  2013 2014  Non-life insurance
                                         2012

Composite insurers            4 4 4 Non-life – Statistics

Life insurers                 29 30 27                    (US$ mln & %)                                                                2012    2013                       2014
                                                                                                                                        1,332   1,331                     1,474
Non-life insurers             76 71 69                    Gross written premium                                                        49.8%    47.7%                     48.7%
                                                                                                                                        40.1%  49.7%                      40.8%
 Total                        109 105 100                 Retention ratio
                                                          Incurred loss ratio                                                             192     136                       223
Life insurance                                                                                                                          2,761   3,312                     3,367

Total premiums                2012 2013 2014              Underwriting results
 (US$ mln)                                                Total assets

Total premiums                2,872 4,060 4,420

Life policies in force                                    Non-life – Gross written premiums by class of business

Policies in force (US$ bln)90                                                                                                   1,600
                                                                                              Gross written premiums (US$ mln)80 6.9
     70 4.6                                                                                                                     1,400
     60
     50                 10.2                                                                                                    1,200
     40 42.7 52.7
     30                 50.6                                                                                                    1,000
     20
     10 20.6 22.1       20.4                   Variable                                                                         800                                       Total
                                               Group                                                                            600                                       Motor
             2011 2012  2013                   Ordinary                                                                         400                                       Fire
                                                                                                                                200                                       Marine

                                                                                                                                      2008 2009 2010 2011 2012 2013 2014

Back to Contents                                                                                                                                                Source: 2015 ASEAN Insurance Statistical Report

                                                                                                                                       AEC – IMPACT ON INSURANCE • DECEMBER 2015 31
   28   29   30   31   32   33   34   35   36   37   38